© Shermaine Chua, 2025
school
infographic design
market research
School Project, Academic Research
Shopalongs, Netnography, Secondary Research
Consumer Behavior, Retail
MSMI-606 Qualitative Marketing Research
For a school project, we had to pick a topic we were curious about and explore it through shopalongs, netnography, and secondary research then present our findings as a fun infographic.
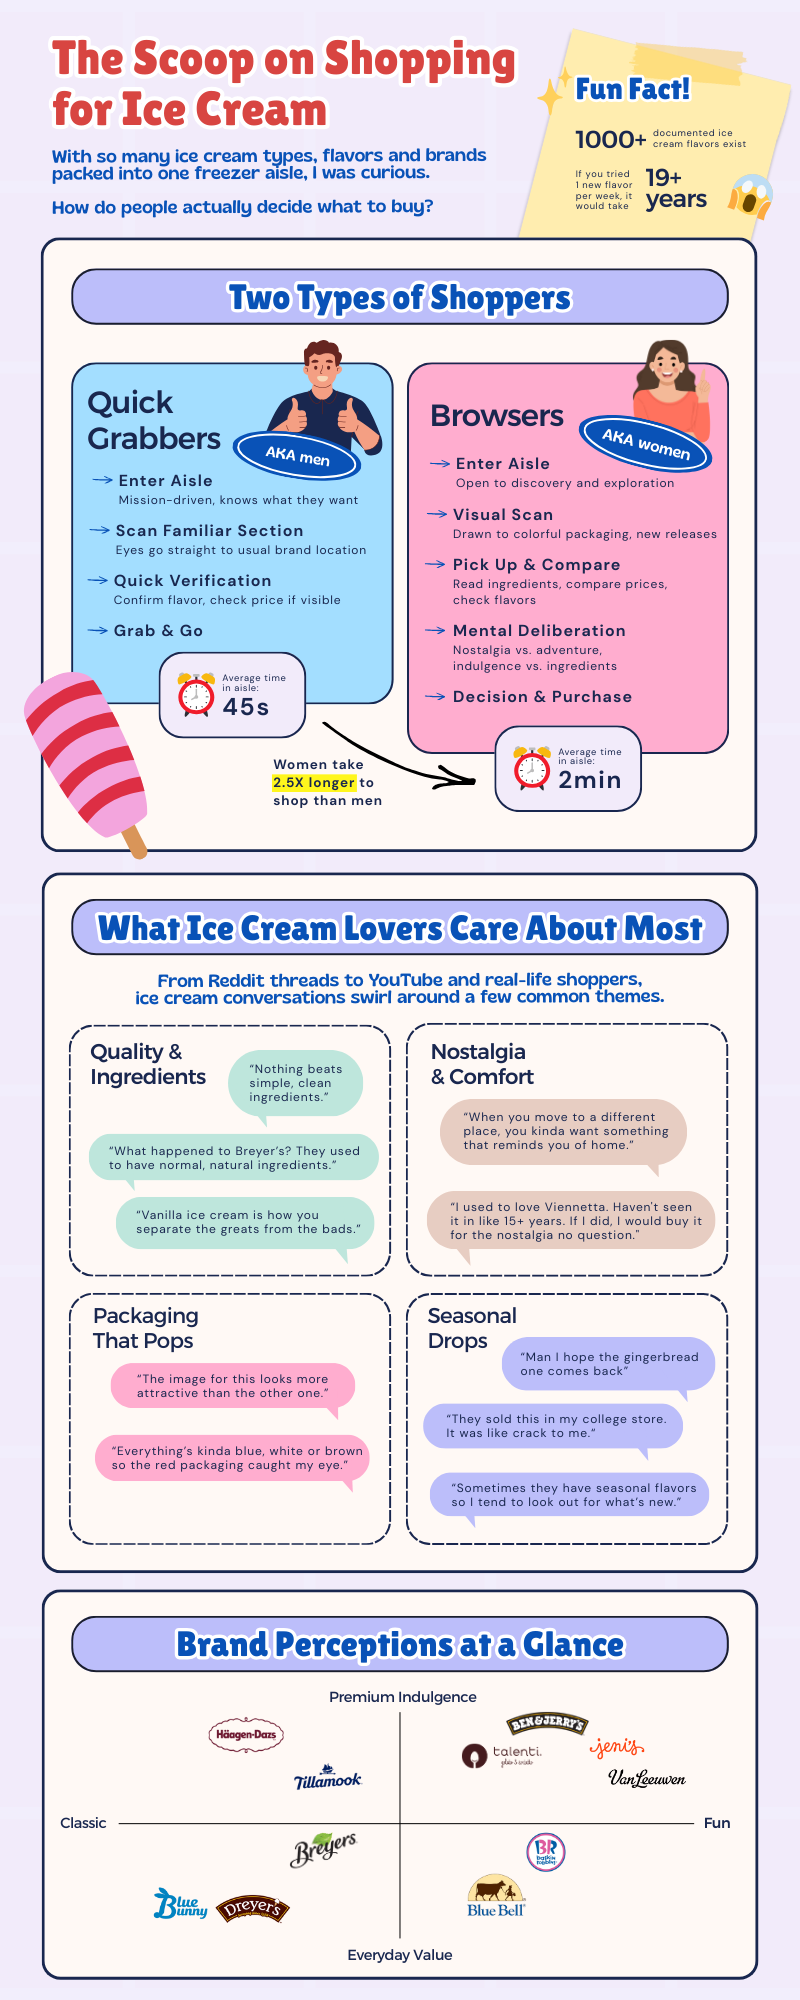
As someone who enjoys browsing the freezer aisle and checking out all the colorful pints, I wanted to know: what actually goes through someone's head when they're choosing ice cream?
I followed three friends on their grocery runs, recording how they browsed, compared options, and made their final picks.
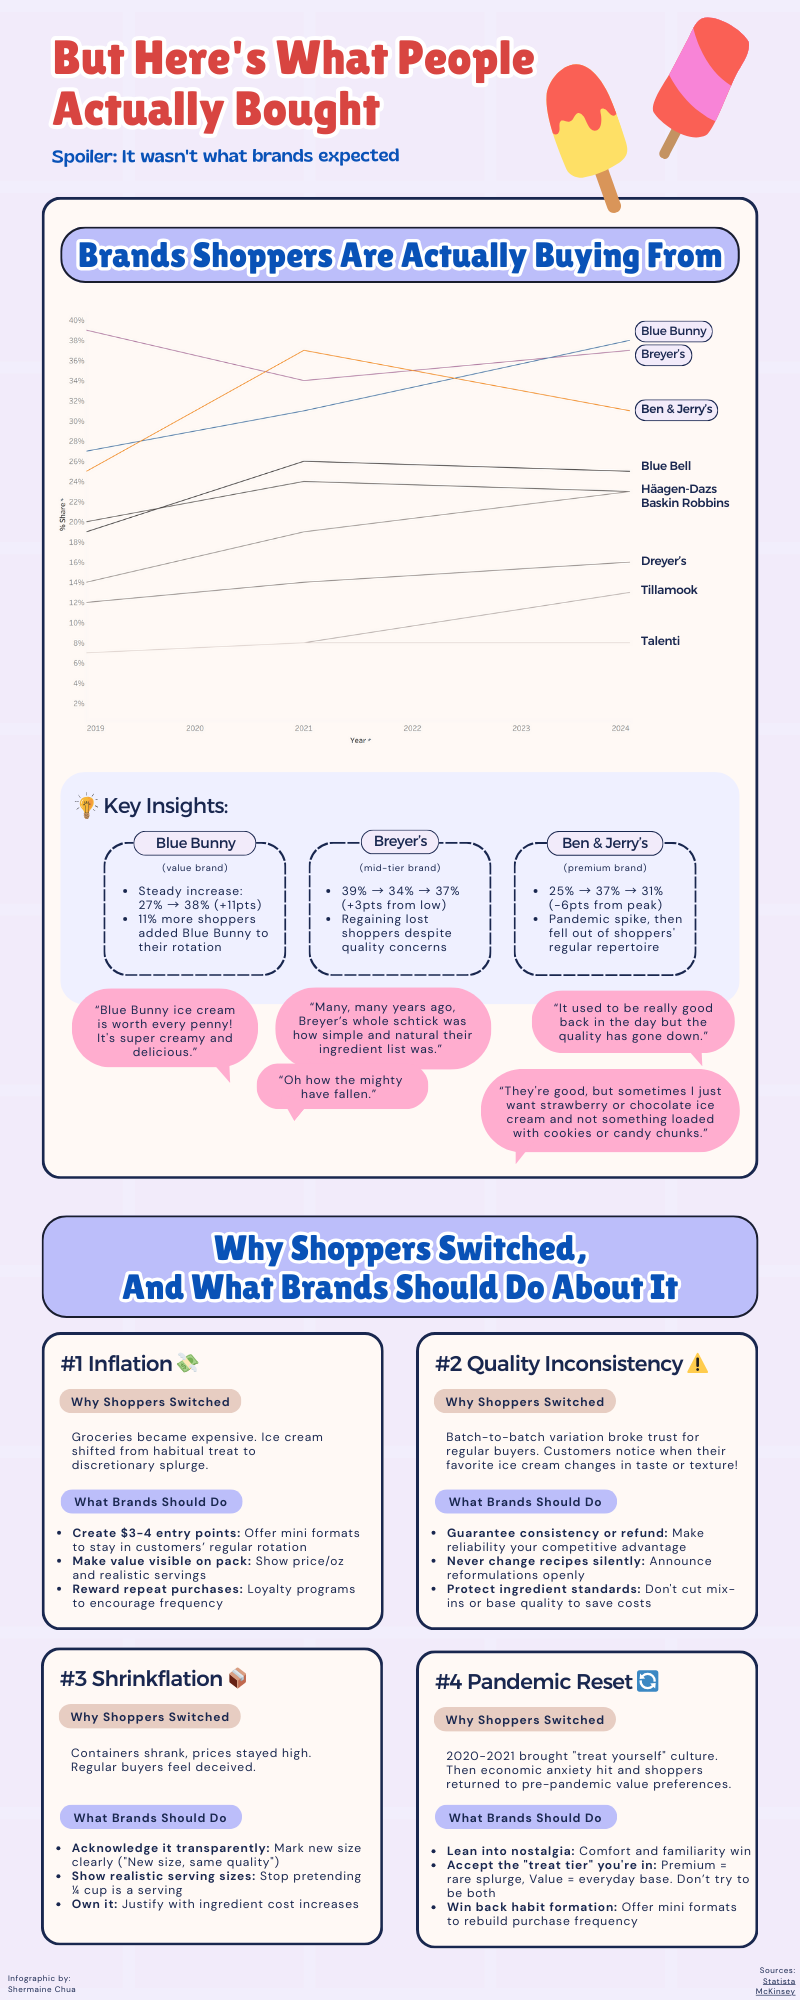
For a broader view, I dug into Reddit threads and YouTube videos to see what people were saying about favorite brands, go-to flavors, and what makes them reach for one pint over another. Secondary research added market context.
even a casual love for ice cream can turn into real insights
Reddit and YouTube surfaced raw, honest opinions about brands
a "simple" ice cream run involves habit, emotion, and budget trade-offs
© Shermaine Chua, 2025